

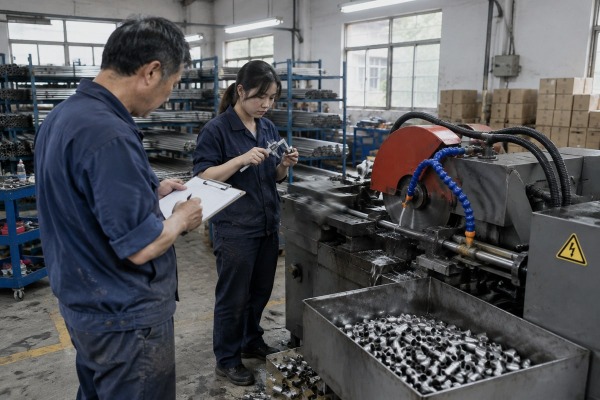
Scrap piles up fast when a fully automatic pipe cutting machine drifts mid-shift. On our Wenzhou line, we learned that lesson early—and built our whole testing protocol around it.
To evaluate stability of a fully automatic pipe cutting machine, define fixed continuous-run test conditions, run the machine 24–72 hours, log every downtime event, measure cut length and squareness at set intervals, track vibration and thermal drift, and verify feeding and clamping consistency across thousands of cycles.
That short answer hides a lot of detail. This article breaks the process into four practical questions. I will cover the metrics to watch, the test duration to demand, the failure points that appear only after hours of running, and how to read supplier reports with a critical eye.
During a factory acceptance test on our Wenzhou line, a buyer asked me which numbers actually matter. We handed him a log sheet with nine columns, not a brochure.
Monitor cut length error, squareness, burr height, cycle time, clamp pressure, vibration magnitude, servo following error, alarm counts, and downtime events. Record each metric at fixed intervals across the run, then chart the trend—stability shows up as flat lines, not just good single readings.

Stability is not one number. It is a set of trends. Our engineers group the indicators into three families: process quality, mechanical health, and control reliability. Each family answers a different question about the machine.
| KPI | What It Reveals | Check Interval | Warning Sign |
|---|---|---|---|
| Cut length error | Cutting precision and repeatability | Every 30–60 min | Growing dimensional tolerance deviation |
| Squareness / perpendicularity | Blade and chuck alignment | Every 30–60 min | Angle drift after warm-up |
| Burr height and edge finish | Tool wear and cut-quality drift | Every hour | Steady rise across the run |
| Cycle time consistency | Automation timing health | Continuous log | Cycles slowing or varying |
| Clamp / hydraulic pressure | Hydraulic pressure consistency | Continuous log | Pressure sag under heat |
| Vibration magnitude | Bearing, spindle, and frame health | Continuous log | Rising level or new frequencies |
| Servo following error | Feed axis accuracy | Continuous log | Increasing lag under load |
| Alarm count | Control system robustness | Continuous log | Repeated soft faults |
| Downtime events | Real availability | Full run | Any unplanned stop |
Vibration analysis deserves special care. ISO vibration guidance for machinery monitoring 1 supports broadband measurement and stresses two things: the absolute magnitude, and how it changes over time under steady-state operation. Sensor placement matters too. We mount accelerometers on bearing housings or pedestals, in two orthogonal radial directions, because that is where dynamic forces show up best. On top of that, acoustic signature monitoring can catch micro-noises from bearing stress or gear backlash before any physical failure appears.
A perfect reading at hour one means little. The SERP consensus is clear: track dimensional tolerances 2 over a continuous 24-to-72-hour cycle to catch precision drift. Plot every metric against time. A flat line is stability. A slope is a warning.
A procurement manager from the US once messaged us on WhatsApp: two hours of demo cuts looked perfect—was that enough? Our answer changed his whole acceptance checklist.
Run a minimum of 24 hours of continuous testing, and extend to 72 hours for high-volume or unattended production. Shorter 8-hour runs reveal thermal drift, but only multi-day tests expose wear trends, control faults, and Mean Time Between Failures data you can actually trust.

Before any clock starts, define the test conditions. This is the first rule we apply on our own equipment: fix the pipe material, diameter, wall thickness, cut length, and cycle rate before the run begins. If the conditions float, the results mean nothing. Only after the conditions are locked do we set the duration.
| Test Duration | What It Proves | What It Misses | Best For |
|---|---|---|---|
| 2–4 hours | Baseline accuracy, warm-up behavior | Wear trends, rare faults | Initial commissioning |
| 8 hours | Thermal deformation across one shift | Multi-shift drift, MTBF data | Single-shift production |
| 24 hours | Full thermal cycle, control robustness | Long-term wear patterns | Standard acceptance testing |
| 72 hours | Wear trends, real MTBF evidence, unattended reliability | Very little | High-volume or lights-out lines |
Some suppliers argue that short sample cuts and static accuracy checks prove quality. I understand the appeal—it saves everyone time. But this view misses failure modes that only appear after hours of heat buildup, vibration accumulation, and repeated loading. Thermal deformation is the classic example. Spindles, motors, and hydraulic systems all warm up at different rates. Accuracy at a cold start and accuracy at hour ten can be two different machines.
There is also a statistical reason for longer runs. Research on automated stability testing in machining uses repeated test cuts in a closed loop, continuing until measurement uncertainty drops to a target level. The same logic applies here. A handful of cuts gives you an impression. Thousands of cycles give you evidence. Mean Time Between Failures, by definition, cannot be estimated from a two-hour demo. When our customers plan unattended night shifts, we push them toward the 72-hour tier, because that is where rare control faults and slow wear trends finally show themselves.
Hour fourteen taught our engineering team more than any datasheet. A clamp that held perfectly at hour one began micro-slipping once heat and coolant residue built up on the jaws.
Watch for clamping slippage, feeding misalignment, blade or tool wear, spindle vibration, thermal deformation, hydraulic pressure loss, PLC logic errors, and sensor drift. Most failures start as small trend changes—rising burr height, growing length deviation, or new acoustic signatures—long before a visible breakdown occurs.

A fully automatic pipe cutting machine fails differently from a general CNC machine. Long stock, varying diameters, and the constant feed-load-cut-repeat cycle create unique sources of drift. Our team maps failure points by subsystem, because each one leaves a different fingerprint in the data.
| Subsystem | Typical Failure | Early Symptom | How to Detect |
|---|---|---|---|
| Clamping | Slip, ovalization, micro-shift | Length scatter, angle drift | Clamp pressure log, cut measurements |
| Feeding | Positioning error, backlash | Material feeding accuracy degrades | Servo following error, length trend |
| Cutting tool | Blade wear, edge chipping | Rising burr height, rougher finish | Consumable wear-rate tracking |
| Spindle / bearings | Vibration, chatter | New frequency peaks | Vibration analysis, acoustic monitoring |
| Structure | Sway under high-speed feed | Squareness drift | Frame stiffness check, cut angle data |
| Hydraulics | Fluid thinning under heat | Pressure sag | Hydraulic pressure consistency log |
| PLC control system | Logic lag, sensor drift | Cycle timing variation, soft alarms | Alarm log, cycle-time chart |
Two failure sources hide outside the machine itself. First, power quality: heavy industrial environments produce voltage sags and harmonic distortion 3, and the machine's electronics must ride through them without logic errors. Second, factory air: particulates and humidity slowly attack sensor accuracy and change lubrication viscosity. We test for both because export customers run our equipment in very different plant conditions, from dry workshops in Mexico to humid coastal factories in India.
Mechanical wear resistance decides how fast these failure points advance. Hardened guide surfaces, quality bearings, and rigid frames do not remove failure modes—they just slow the trend lines down. That is exactly why trend logging matters more than any single inspection.
Every export deal we close involves a trade-off: deeper validation raises cost and slows delivery, but weak evidence raises after-sales risk. Reading test reports critically balances both sides.
Compare supplier reports by checking test duration, defined run conditions, raw interval data, downtime logs, and alarm records. Reject reports built on short sample cuts or static accuracy checks. Demand time-stamped measurements, video evidence, and the option to witness or replicate the continuous test yourself.

Our team reviews competitor reports often, and the difference between marketing and evidence is easy to spot once you know the pattern. Here is the five-step review process we recommend to procurement managers:
| Report Element | Weak Report | Strong Report |
|---|---|---|
| Duration | 20 sample cuts | 24–72 hours continuous |
| Data format | Averaged summary | Time-stamped interval logs |
| Downtime | Not mentioned | Every stop logged with cause |
| Vibration | Ignored | Baseline plus trend over time |
| Availability metric | None | MTBF and Overall Equipment Effectiveness estimate |
| Verification | Trust us | Witness test or replication offered |
One buyer objection deserves a direct answer: is sensor-heavy monitoring overkill for a simpler pipe cutter? For a low-duty machine, maybe. But when uptime, unattended operation, and high-volume output drive your business case, instrumentation pays for itself in avoided scrap and returns. Some advanced suppliers now offer digital twin synchronization, comparing live test data against a theoretical stability model to flag subtle deviations. You do not need to demand that level everywhere—but you should reward suppliers who log more than they promise.
Stability is not one accuracy number. It is proven precision across 24–72 unattended hours. Define conditions, log everything, watch the trends—then buy or ship with confidence.
Interested in sourcing the products mentioned in this article? See details and request a quote here:
1. Authoritative international body for industrial standards, including vibration monitoring and machine health diagnostics. ↩︎
2. US federal agency providing official standards for measurement science and calculating uncertainty in engineering. ↩︎
3. World’s largest technical professional organization for advancing technology, including power quality and electronics standards. ↩︎
