

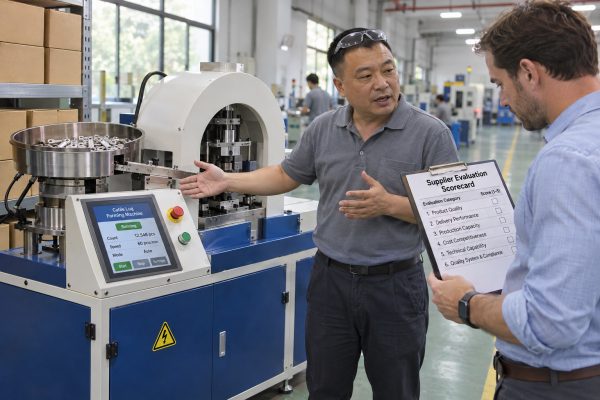
Cheap cable lug making machines often stall weekly, bleeding margins. I have watched buyers suffer this before our Wenzhou team stepped in. Long-term supplier performance metrics prevent it.
The right metrics to evaluate cable lug making machine suppliers’ long-term performance cover six dimensions: equipment quality (Cpk, first-pass yield), delivery capability (on-time delivery rate), after-sales service (response and resolution time), technical support, cost control (total cost of ownership), and cooperation stability, each scored with verified multi-year evidence.
A brochure tells you what a machine should do. Only measured data tells you what a supplier actually does over years. The four sections below show how I score delivery, quality, support, and technical capability. I will share the scorecard we use at the end.
A procurement manager in the United States once told me his last supplier's delays cost him more than the machine. That conversation shaped how we report milestones today.
Measure on-time delivery performance by tracking the supplier's on-time delivery rate across every milestone: design approval, tooling, factory acceptance test, shipment, and commissioning. Compare promised versus actual dates, count schedule slips, and ask for references showing at least twelve months of delivery history.

Delivery is not a single date. For a custom cable lug terminal machine, delivery is a chain of promises. If the supplier misses the design freeze, the tooling slips. If tooling slips, the factory acceptance test slips. By the time the crate reaches your dock, the delay has multiplied. So I never score a supplier on the final ship date alone. I score every link in the chain.
When we build an OEM/ODM machine for a customer in Germany or India, we agree on a milestone schedule before the deposit is paid. Each milestone has a promised date, an actual date, and an owner. The buyer can then calculate an on-time delivery rate per milestone, not just per order.
| Milestone | What the supplier must deliver | Metric to record |
|---|---|---|
| Specification sign-off | Material grade, conductor range, die sets, press force, tolerances, reject limit, changeover time | Days from inquiry to approved spec |
| Final design | Drawings, PLC logic outline, utilities list | Days from spec to design; number of engineering changes |
| Tooling ready | Die sets for the full product mix | Tooling lead time versus quote |
| Factory acceptance test | Repeated runs on the buyer's own materials | Pass on first attempt or not |
| Shipment | Export packing, documents, logistics booking | Promised versus actual ship date |
| Site acceptance | Machine running on local utilities with local operators | Days from arrival to signed acceptance |
Here is a trade-off I raise with every buyer. A standard machine usually ships faster and is easier to support with spare parts. A customized machine fits the process better but depends more on the supplier's engineering discipline. Neither choice is wrong. What matters is that the supplier can show how often customized projects shipped on schedule. Ask for the percentage of engineering changes delivered on time and the average prototype approval time. A supplier who cannot answer has never measured it.
My practical advice is simple. Tie payment milestones to the factory acceptance test and the site acceptance test. This converts a promise into an obligation. It also protects the supplier, because success is defined in writing. Buyers like William, who distribute equipment under their own label, cannot absorb a late machine. A written milestone plan is the cheapest insurance either side can buy.
During a factory acceptance test last year, a buyer's own aluminum lugs exposed a die drift our standard copper samples had hidden. We fixed it before shipment.
Track first-pass yield, reject and rework rates, Cp and Cpk on critical lug dimensions, dimensional drift as dies wear, and electrical resistance plus pull-out strength of finished connections. Measure these over repeated runs using your own copper and aluminum, not just the supplier's demonstration samples.

"High precision" is a sales phrase. It means nothing until you define which dimension, which tolerance, and over how many cycles. So the first thing I ask a buyer is: which features on your lug actually matter to your customer? Usually the answer is barrel diameter, wall thickness, hole position, and lug length. Those become the critical dimensions. Everything else is secondary.
A machine can hit a dimension once in a demonstration and still drift during a shift. That is why I separate accuracy from consistency. Accuracy is one good part. Consistency is ten thousand good parts after warm-up, after a die change, and after routine maintenance.
| Metric | What it tells you | How to verify |
|---|---|---|
| First-pass yield | Share of lugs accepted without rework | Count across a full sustained run |
| Reject and rework rate | Burrs, cracks, deformation, incomplete forming | Visual and gauge inspection per batch |
| Cp / Cpk on critical dimensions | Whether the process stays centered inside tolerance | Statistical sampling across repeated runs |
| Crimp-force consistency | Stability of forming force where the machine records it | Export force readings from the PLC |
| Dimensional drift versus cycle count | How tooling wear changes geometry | Measure the same dimension at set cycle intervals |
| Electrical resistance and pull-out force | Fitness of the finished connection | Lab test on sample connections |
| Repeatability after die change | Whether setup skill or machine design controls quality | Re-measure after every changeover during FAT |
The standards matter because they define pass and fail. DIN 46235 covers compression cable lugs. IEC 60352-2 addresses crimped connections. IEC 61238-1 applies to compression connectors for power cables. For North American buyers, UL 486A-486B compliance 1 is the reference most of our US customers request. IPC/WHMA-A-620 sets workmanship expectations for the finished harness. I do not claim that every machine we build is tested to every standard. I do insist that the buyer names the standard, and that the acceptance test measures against it.
Dirty, damaged, or worn dies change crimp geometry even when the frame, the hydraulics, and the PLC are all healthy. So I track tooling separately. Record the number of acceptable cycles per die set, the regrinding interval, and the frequency of tool-related rejects. Ask the supplier to document die materials and heat treatment. A supplier who says the dies are "long-lasting" but cannot give an inspection limit has not measured tool life.
Many lug producers switch between copper grades, aluminum, and bimetallic designs. Switching changes spring-back and forming force. I ask buyers to send a sample of every material they run. Then the factory acceptance test covers the complete mix, with changeover time recorded. One narrow demonstration can hide a weakness that only appears on the third material in the mix.
Years of supporting lines in Germany and Mexico taught me one lesson: answering fast and fixing fast are different things. Buyers should measure both separately.
Assess after-sales support by measuring technical response speed, diagnosis time, and time to restore production, plus Mean Time To Repair, spare parts lead time, percentage of cases resolved remotely, repeat service visits, and warranty closure time. Verify these through customer references and written contract commitments.

After-sales technical support is where suppliers with similar machine specifications separate. Two machines can share the same press force and the same production cycle time. One supplier answers a WhatsApp message within the hour and walks the operator through the alarm history on the touchscreen. The other replies three days later with a generic manual. Over five years, that difference is worth more than a small gap in purchase price.
I score three clocks, not one. The first clock runs from the buyer's report to the supplier's acknowledgment. The second runs to a diagnosis. The third runs to restored production. Mean Time To Repair 2 measures the whole chain. A supplier can look excellent on the first clock and poor on the third.
| Clock | Metric | Why it matters |
|---|---|---|
| Acknowledge | Technical response speed in hours | Shows whether anyone is actually watching |
| Diagnose | Hours to identify the cause, often by remote diagnostics | Shows engineering depth |
| Restore | MTTR in hours or days | Shows the real cost to your production |
| Close | Warranty claim approval and closure time | Shows whether the supplier honors commitments |
Our machines run on smart PLC control with alarm and fault histories stored on the controller. That design choice is not a marketing feature. It is a service tool. When an operator in Italy sends the fault log, our engineers in Wenzhou can often identify a sensor or valve issue before anyone books a flight. So I ask buyers to record the percentage of support cases resolved remotely. A high percentage shortens MTTR and cuts travel cost.
Here is an objection I hear often: "A local supplier can always respond faster, so why buy overseas?" Local presence helps, but only if the local supplier stocks the parts. A supplier across the ocean with a documented two-year spare parts list, clear part identification, and emergency shipment capability can beat a local supplier who orders every seal from a subcontractor. Measure spare parts availability 3 directly: average lead time, percentage of parts stocked locally, backorder history, and the obsolescence policy for controllers and drives. Critical items usually include sensors, seals, hydraulic pumps, valves, relays, dies, and safety components.
Define what the warranty covers, whether travel and labor are included, which parts are excluded, and how downtime disputes are handled. Define an escalation path for unresolved problems. Then ask references whether the supplier actually followed those terms. A contract clause only counts if it has been honored.
Every time we quote a hydraulic press against a servo-electric design, I weigh force against process data. The right benchmark depends on the buyer's duty cycle.
Judge long-term reliability using Mean Time Between Failures, machine uptime percentage, Overall Equipment Effectiveness, sustained good parts per hour, changeover time, tooling life per die set, ISO 9001 certification, and documented reliability data from comparable installations over 12 to 24 months, then combine these into a weighted scorecard.

Nominal speed is the number every brochure shows. Some supplier guidance treats a production cycle time under five seconds as a target for high-volume lug production. That figure is useful as a starting point. It is useless as a decision tool. A fast cycle means nothing if loading, inspection, cleaning, and die changes eat half the shift. The metric that pays the bills is saleable output per shift.
| Benchmark | What to request from the supplier | Where it fails in practice |
|---|---|---|
| Sustained good parts per hour | Output after setup, measured over a full run during FAT | Suppliers quote theoretical speed only |
| Overall Equipment Effectiveness 4 (OEE) | Availability × performance × quality from reference sites | Only availability is reported |
| Machine uptime percentage | Scheduled time minus unplanned downtime | Planned maintenance is counted as uptime |
| Mean Time Between Failures 5 (MTBF) | Field data from comparable installations, ideally 12 to 24 months | Data comes from a lab, not a factory |
| Changeover time | Minutes between lug sizes, including die alignment | Measured by the supplier's best technician |
| Tooling life | Acceptable cycles per die set and dimensional drift curve | Stated as "long-lasting" without limits |
| Force accuracy | Published guidance cites roughly ±5% for certain equipment | Treated as universal rather than tested |
| Maintenance interval | Some guidance suggests 5,000–10,000 cycles or monthly under heavy use | Applied without checking load and material |
Buyers ask me which drive is "more reliable." The honest answer depends on the application. Hydraulic systems deliver high force and suit heavy forming of thick-wall lugs, but they bring hoses, seals, oil, and filters into the maintenance plan. Servo-electric systems run cleaner, control position precisely, and record detailed force data per cycle, which strengthens traceability. If the buyer needs maximum force and has hydraulic maintenance skills, hydraulic wins. If the buyer values process data and lower energy per good part, servo-electric wins. The benchmark should be energy consumption per good part and MTBF under the buyer's real duty cycle, not the drive technology itself.
A machine may run for a decade, so I also score the supplier as a business. Our team in Wenzhou is small, with ten people, and I say that openly. What buyers should check is the number of installed machines, comparable references, in-house versus outsourced manufacturing, ISO 9001 certification 6 where applicable, and the history of resolving field problems. Years in business alone prove nothing. A newer supplier may offer better PLC control and data export; an older one may innovate slowly. Ask for upgrade and retrofit history, and for software change control on the controller. Smart-grid terminal designs keep changing, so R&D alignment is a reliability metric too.
CE conformity, guarding and interlock performance, emergency-stop function, and electrical schematics must apply to the machine you receive, not a similar model. Custom tooling or control changes can affect the original assessment. I treat this as an ongoing supplier responsibility.
The author's insight that shapes our method is simple: score every supplier on six dimensions with numbers. We rate each on a scale, weight the result, and compare. The weights below are a starting point. A high-volume automotive buyer should raise the weight on quality and reliability. A small job shop may raise cost control and flexibility.
| Dimension | Example weight | Evidence to score it |
|---|---|---|
| Equipment quality | 25% | Cpk, first-pass yield, FAT results, tooling drift data |
| Delivery capability | 15% | On-time delivery rate per milestone, change-request history |
| After-sales service | 15% | Response speed, MTTR, remote resolution rate, warranty closure |
| Technical support | 15% | Training quality, documentation in the buyer's language, upgrade history |
| Cost control | 20% | Total Cost of Ownership per good lug, energy, spares, downtime |
| Cooperation stability | 10% | References, installed base, transparency on failures, ownership stability |
Total Cost of Ownership (TCO) is the dimension buyers most often underweight. Divide total lifecycle cost — purchase, freight, installation, tooling, energy, maintenance, spares, downtime, scrap, and disposal — by the number of acceptable lugs produced. One manufacturing framework claims ownership-cost reductions of 22% from this kind of analysis. I would not promise that result. I would say the lowest quotation very often becomes the highest cost per good lug.
Cheap quotes hide expensive downtime. The fix is simple: score suppliers on quality, delivery, service, technical support, cost, and stability using verified evidence, then choose accordingly.
1. UL Solutions provides the safety standards for wire connectors and lugs used in North America. ↩︎
2. Standard industrial definition of MTTR used to evaluate maintainability and service responsiveness. ↩︎
3. The International Trade Administration provides resources on global supply chain logistics and equipment maintenance. ↩︎
4. Comprehensive overview of OEE, the standard for measuring manufacturing productivity and machine utilization. ↩︎
5. IEEE is a leading authority on technical standards and reliability metrics for industrial electronic equipment. ↩︎
6. Official ISO page for the primary international standard governing quality management systems in manufacturing. ↩︎
