

Energy efficiency in an automatic chamfering machine 1 rarely shows on a quote sheet. I watch buyers of our Wenzhou-built machines compare motor ratings, choose the smaller number, and overpay for years.
Evaluate automatic chamfering machine energy efficiency by measuring energy per acceptable part, not nameplate wattage. Request idle, cutting, and auxiliary power data, test with your real workpiece, check for servo or VFD drives, and ask for ISO 14955 measurements before you buy.
That answer is the short version. The rest of this article shows you how to get those numbers from a supplier, how to turn them into money, and how to tell real efficiency from marketing.
A procurement manager in Canada once sent me two spec sheets and asked why our bigger spindle cost less to run. Both nameplate figures told him almost nothing.
Compare rated input power, typical cutting power, idle power consumption, standby draw, compressed-air flow at stated pressure, auxiliary loads like pumps and extraction, and power factor. Then convert everything into kilowatt-hours per 1,000 acceptable parts measured at the machine's incoming supply.

The problem with most spec sheets is simple. They list connected load. Connected load is the maximum installed capacity. It is not what the machine draws while making your parts. A 3 kW spindle rating tells you what the drive can deliver at full torque. It does not tell you what the machine pulls while clamping, indexing, blowing chips, or waiting for a feeder.
When I review a competitor sheet with a customer, I ask one question first. Where was this number measured? If the answer is "the motor plate," the number is not comparable. The only fair measurement point is the incoming electrical supply to the whole machine. That point captures the spindle, the feed axes, the control cabinet, the coolant pump, the extraction fan, lighting, and lubrication together.
Here are the power consumption metrics I ask every supplier to put on paper.
| Metric | Why it matters | What to demand |
|---|---|---|
| Rated input power | Sizes your electrical supply | Value at incoming terminals, not motor plate |
| Typical cutting power | Real draw during chamfering | Measured on your material and chamfer size |
| Idle power consumption | Dominates intermittent production | Controls and auxiliaries on, no cutting |
| Standby draw | Cost when connected but stopped | Overnight and weekend figure |
| Startup and warm-up | Hidden cost of frequent shutdowns | Energy per cold start |
| Compressed-air flow | Often invisible on the electric bill | Flow at stated pressure and duty cycle |
| Auxiliary loads | Pumps, conveyors, fans, lights | Individual ratings and duty cycle |
| Power factor | Avoids reactive power surcharges | PF at typical load, with correction if fitted |
I like to break a machine's day into states: off, idle, setup, processing, tool change, and cleaning. ISO 14955 frames efficiency the same way. It looks at the relationship between energy supplied and the useful machining result, by function and condition, not by one headline number. Ask your supplier for a breakdown by state. If they cannot provide it, the machine probably has no energy monitoring built into the control.
Air is the quiet budget killer. Only about 5–20% of compressor input energy becomes useful work at the point of use. Leaks alone can waste 20–30% of compressor output. In some plants, compressed air 2 reaches up to 30% of the site electricity bill. An automatic chamfering machine uses air for clamping, blow-off, part ejection, and door cylinders. Ask for air consumption in standard cubic feet per minute or normal cubic metres per hour, at a stated pressure, during both cutting and standby. A flow figure without pressure is meaningless.
Auxiliary systems deserve the same scrutiny. Coolant pumps, chip conveyors, extraction fans, and lighting can account for up to 15% of total draw on some machines. On our units, I push for LED lighting and demand-controlled pumps for exactly this reason.
Early on, our engineers quoted kilowatt savings instead of dollar savings, and buyers shrugged. The lesson stuck: nobody budgets in kilowatts, so we now model cost per part first.
Multiply measured energy per acceptable part by annual volume and your electricity tariff, add idle, setup, and standby energy, then include compressed air, coolant, tooling, scrap, and maintenance. Compare that lifecycle cost against the custom machine's price difference over its expected service life.

A custom machine costs more up front than a standardized low-cost unit. That is true of everything we build. So the calculation has to show where the money comes back. Energy is one stream. Operational cost reduction from fewer rejects, shorter cycles, and less labor is usually a bigger one. Here is the process I walk buyers through.
| Line item | Machine A (standard) | Machine B (custom) | Notes |
|---|---|---|---|
| Energy per acceptable part (kWh) | Measured | Measured | From production test |
| Annual acceptable parts | Your forecast | Your forecast | Same for both |
| Electricity tariff | Local rate | Local rate | Include demand charges |
| Idle + standby energy per year | Measured idle × hours | Measured idle × hours | Check sleep mode |
| Compressed-air cost per year | Flow × pressure × hours | Flow × pressure × hours | Electric actuators reduce this |
| Scrap and rework cost | Reject rate × part value | Reject rate × part value | Often the largest gap |
| Tooling and maintenance | Supplier data | Supplier data | Ask for tool life on your material |
| Purchase price difference | — | Extra cost | Include installation and electrical upgrades |
| Payback period | — | Price difference ÷ annual savings | Use conservative assumptions |
Some buyers tell me electricity is a small part of their cost, so efficiency should be a secondary concern. For a machine that runs two hours a day, that is partly right. But in my experience, efficient machines also run cooler, wear slower, and carry better controls. Heat dissipation drops, bearings last longer, and cycle time optimization becomes possible because the drives respond faster. The metric I push is throughput per kilowatt-hour. It captures productivity and energy in one number. It also gives you a defensible carbon footprint figure if your customers ask for one, which more of our European buyers now do.
The first thing I check on any chamfering design we build is the drive and feed mechanism. A servo that powers only on demand beats a bigger motor.
Yes. Servo motor technology reduces energy usage because it draws current only when the axis or spindle needs torque, holds position with minimal power, and can regenerate during braking. Savings are largest in high-duty-cycle automatic chamfering equipment and smaller when idle time or compressed air dominates consumption.

Here is the plain mechanical truth. A fixed-speed induction motor 3 spins at full speed whether it is cutting or not. A pneumatic cylinder 4 consumes compressed air on every stroke, and that air was expensive to make. A servo-driven feed axis 5 sits still and draws almost nothing until the control tells it to move. Then it supplies exactly the torque the cut needs. That is what I mean by supplying energy on demand. It is the first thing I evaluate on a drive and feed system, before I even look at the motor plate.
| Drive type | Energy behavior | Best fit | Watch out for |
|---|---|---|---|
| Fixed-speed AC motor | Full speed always, high idle draw | Simple, low-cost machines | Wasted energy between parts |
| Variable Frequency Drive | Matches speed and torque to material | Spindles with varied materials | Still runs when idle unless programmed |
| Servo motor technology | Power on demand, precise positioning | Feed axes, indexing, high-volume cells | Higher initial cost |
| Pneumatic actuator | Air on every stroke, 5–20% useful energy | Simple clamp or eject | Leaks, pressure drop, compressor load |
| Hydraulic system | Pump often runs continuously | Heavy clamping | Standby pump losses, heat |
Ask whether the servo drives are regenerative. During deceleration, a regenerative drive feeds energy back into the DC bus or the plant grid instead of burning it in a brake resistor. Some suppliers call this a kinetic energy recovery system. On a chamfering machine with short, repeated index moves, the braking events add up across a shift.
The hydraulic vs electric systems choice matters more than many buyers expect. A hydraulic clamp needs a pump. If that pump runs continuously, it draws power and generates heat all day, even when the clamp is open. A variable-displacement pump or a pressure-on-demand control reduces that waste. An electric servo clamp removes the pump entirely. When we design custom equipment for cable lug and terminal processing, we lean toward electric actuation wherever the clamping force 6 allows it. Fewer hoses, fewer leaks, and far less heat dissipation inside the cabinet.
A smarter drive on a wasteful process is still a wasteful machine. I also check whether the chamfering method itself is energy-saving. Does it finish the edge in one pass? Does it need through-tool coolant at all? Can it hold quality at a lower spindle speed? A machine that chamfers both ends of a terminal in one clamping cycle removes a part reversal and a second clamp stroke. That saves more than any motor upgrade.
One honest caveat. If your machine idles 70% of the day, or if blow-off air dominates consumption, the servo saving shrinks. In that case, fix the idle logic and the air nozzles first.
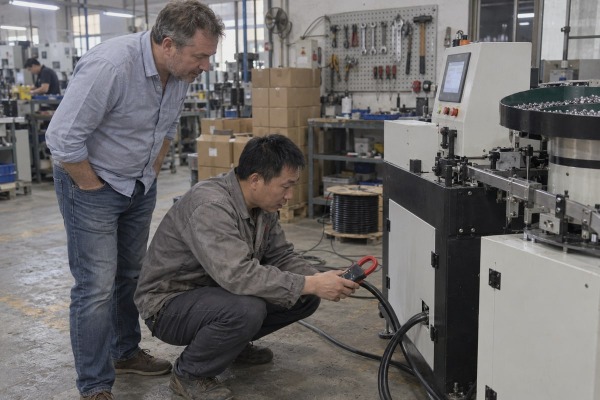
During a factory acceptance test for a Mexican customer, I clamped a power meter on the incoming line while the machine ran their actual parts. That reading settled the debate.
Ask about ISO 14955-1 for machine-tool eco-design, ISO 14955-2 for energy measurement methods, ISO 14955-3 for reference-scenario testing, and IEC motor efficiency classes IE3 or IE4. Also request power factor data, a signed energy datasheet, and acceptance-test provisions that make energy performance a contractual specification.

Standards give you a common language. They do not replace a test on your own parts. I treat them as the framework and the production test as the proof. Here is what each one does for you.
| Standard or rating | What it covers | How to use it when buying |
|---|---|---|
| ISO 14955-1 | Eco-design methodology for machine tools; links energy supplied to useful result | Ask whether the design followed it and which functions were analyzed |
| ISO 14955-2 | Methods for measuring energy supplied to machine tools and components | Request measurements made this way at the incoming supply |
| ISO 14955-3 | Reference-scenario evaluation for machine-tool functions | Ask for operating-state data: off, idle, setup, processing, tool change |
| IE3 / IE4 motor classes | Premium and super-premium motor efficiency | Verify on spindle, pump, and fan motors, not just one |
| Power factor | Effective use of current; avoids reactive-power surcharges | Request PF at typical load and ask about correction |
These are the industrial automation standards I expect a serious supplier to recognize. If a sales contact has never heard of ISO 14955, that tells you something about how their machines were designed.
Energy claims should be testable specifications, not slogans. Ask for:
That last item is the one I push hardest. On our custom machines, I prefer the buyer to witness the measurement, in person or over video, before shipment. It protects both sides.
Some buyers say all this testing adds procurement burden. My answer is to scale the effort to the stake. A low-duty standalone machine needs one measured run on representative parts. A high-volume automated cell with feeder, robot, and inspection justifies a full operating-state and lifecycle-cost analysis. Measure the whole cell, not the chamfering unit alone. Count acceptable parts per total kilowatt-hour.
| Criterion | Suggested weight |
|---|---|
| Energy per acceptable part | 25% |
| Throughput and cycle time | 20% |
| Idle and standby consumption | 10% |
| Compressed-air demand | 10% |
| Auxiliary-system efficiency | 10% |
| Quality, scrap, and rework | 10% |
| Purchase and lifecycle cost | 10% |
| Monitoring, documentation, and service | 5% |
Adjust the weights. High-volume plants should emphasize energy per part and auxiliaries. Job shops should weight standby power and changeover speed higher. Integrated IoT energy telemetry makes energy a tracked KPI per shift, which is how our customers in South Korea and the US now report their carbon footprint upstream.
Nameplate wattage hides the real bill. Measure energy per acceptable part, include every auxiliary, verify servo drives and ISO 14955 data, and your chamfering machine pays back honestly.
Interested in sourcing the products mentioned in this article? See details and request a quote here:
1. Wikipedia entry for chamfering, providing context for the machining process. ↩︎
2. Department of Energy resource on industrial compressed air system efficiency. ↩︎
3. US Department of Energy guide on industrial motor systems and efficiency. ↩︎
4. Scientific overview of pneumatic cylinder engineering and industrial applications. ↩︎
5. Technical overview of servomotor operation and efficiency benefits. ↩︎
6. ScienceDirect topic page explaining clamping force in mechanical engineering. ↩︎
