

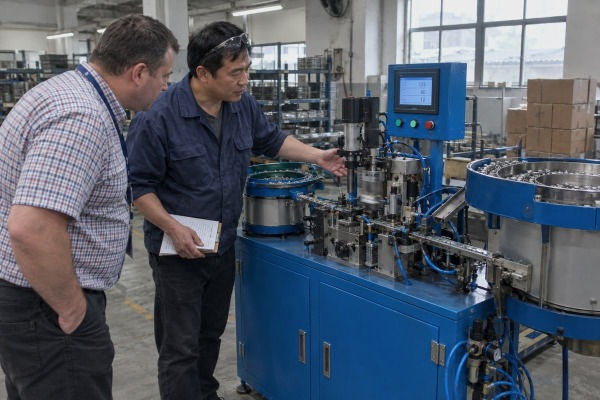
Getting production capacity and cycle time wrong can sink an automation purchase. At our Wenzhou factory, I’ve watched buyers overpay for speed their real demand never justified.
Determine production capacity by converting annual demand into takt time, then compare it against the machine’s bottleneck cycle time adjusted for uptime, scrap, changeovers, and maintenance. A machine meets your needs only when its realistic annual output — not its nameplate speed — exceeds demand with margin for growth.
That single sentence hides a lot of detail. So let me walk you through it step by step. We will cover the math, the hidden time losses, the verification tests, and the cost trade-offs. By the end, you will know exactly what to ask any supplier — including us.
Last quarter, a US procurement manager sent us terminal lug drawings and asked for our fastest machine. My first question back was simple: how many units per year?
Calculate needed capacity by dividing annual customer demand by your available production hours to get a takt time target. Then add buffers for scrap rate, planned maintenance, and demand growth. Your machine’s actual cycle time must be shorter than this takt time to meet demand reliably.

Most buying mistakes start here, so let me be blunt. Takt time is a demand target. Cycle time is a machine property. They are not the same thing, and confusing them is the fastest way to buy the wrong equipment. When we scope a custom cable lug or terminal machine for a client, we always start with their demand numbers — not with our machine catalog. This follows a rule I apply to my own purchasing too: calculate strictly according to your own capacity needs first, then judge machines against that number.
The takt time calculation 1 is simple. Takt time equals available production time 2 divided by customer demand. Available time means real working seconds, after you subtract breaks, planned maintenance, and shift changeovers. Do not use calendar hours. That inflates your available time and hides the gap.
Then adjust for quality. If your pass rate is 98%, you must build more units than you sell. Yield and first-pass quality belong in the calculation from day one, not as an afterthought. Overall Equipment Effectiveness ties this together: Availability × Performance × Quality gives you the discount factor between nameplate capacity and real output.
Here is a realistic scenario I run with clients before quoting:
| Step | Value | Note |
|---|---|---|
| Annual demand | 1,500,000 units | From customer forecasts |
| Working schedule | 250 days × 2 shifts × 7.5 effective hours | Breaks already removed |
| Available time | 3,750 hours = 13,500,000 seconds | Real production seconds |
| Takt time | 13,500,000 ÷ 1,500,000 = 9.0 s/unit | Demand target |
| Adjusted for 98% pass rate | ~8.8 s/unit | Must build extra units |
| Adjusted for 85% OEE | Machine ideal cycle time ≤ ~7.5 s | Your real spec |
Notice the result. Demand said 9 seconds. Reality says the machine must cycle at 7.5 seconds or better — roughly 480 good units per hour. That gap is where under-specified machines fail.
When we commission a terminal lugs assembly machine in our workshop, we time every station separately before we ever quote a cycle time to the buyer.
Real cycle time is set by the slowest station plus transfer or indexing time, then stretched by part feeding jams, micro-stoppages, changeovers, thermal drift after cold starts, and unplanned downtime. Machine architecture — rotary, inline, or robotic — also defines the achievable cycle-time range.
The spec sheet gives you one number. The production floor gives you another. The difference comes from a handful of factors that we see over and over across the machines we build and export.
A multi-station machine runs at the speed of its slowest operation, plus the time needed to index or transfer parts between stations. This is basic bottleneck analysis. If nine stations cycle at 3 seconds and one crimping station needs 6 seconds, your machine is a 6-second machine plus transfer time. Nothing else matters until that station improves. Always ask a supplier which station is the bottleneck and what the index time is.
Different machine layouts have very different speed and volume characteristics:
| Architecture | Typical cycle time | Annual volume sweet spot | Best fit |
|---|---|---|---|
| Rotary indexing table | 2–8 seconds | 1,000,000+ units | Stable, high-volume products |
| Inline / synchronous transfer | 3–12 seconds (5–15 s per station) | 100,000–2,000,000 units | Scalable multi-station lines |
| Robotic / flexible cell | 5–20 seconds (up to 30 s) | 10,000–500,000 units | High-mix, medium volume |
Several quiet killers erode real speed. Vibratory bowl feeders jam when incoming part tolerances drift, and every jam needs an operator. Micro-stoppages — sub-second hesitations that never trigger an alarm — can cumulatively erode hourly capacity by 5–10%. High-precision components also have a thermal stabilization window; during the first hour after a cold start, cycle times can fluctuate and accuracy can drift. Pick and place speed on robotic stations depends heavily on part orientation and gripper design, not just the robot’s rated velocity. Even the PLC control systems 3 matter: scan times and motion profiles add small delays that compound across millions of cycles.
Early in our export business, a customer showed us a competitor’s spec sheet promising output the machine never delivered. That moment shaped how we run acceptance tests today.
Verify claims through a Factory Acceptance Test using your real parts, a timed continuous run of several hours, and written guarantees on uptime, scrap rate, and cycle time. Ask for bottleneck station data, maintenance schedules, and confirm downtime allowances before signing any purchase order.

Trust is good. A stopwatch is better. Whenever we ship a custom machine — whether to Mexico, Slovakia, or the United States — we invite the buyer to witness a Factory Acceptance Test 4, either in person or over live video. I recommend you demand the same from any supplier, including us. And do not stop at cycle time. Confirm with the supplier how long routine maintenance takes, how much downtime to expect per shift, and how the machine performs during sustained running. Those three answers, judged together, tell you far more than a headline speed.
| Question for the supplier | Why it matters |
|---|---|
| Which station is the bottleneck? | It sets the true maximum output |
| What is the transfer or index time? | Often ignored in quoted cycle times |
| What machine uptime and downtime assumption backs your capacity claim? | Converts nameplate speed to real output |
| How does the machine handle part tolerance variation? | Predicts feeder jams and stoppages |
| How long is a product changeover? | Critical for multi-variant production |
| What scrap rate should we expect? | Affects how many units you must build |
| What routine maintenance is needed, and how long does it take? | Planned downtime cuts annual capacity |
| What capacity will you guarantee at FAT and SAT? | Makes the claim contractual, not marketing |
If a supplier hesitates on any of these, treat it as a signal. We also encourage buyers to plan for edge-based analytics after installation, so micro-stoppages get logged and fixed instead of silently draining capacity.
Every custom quote we prepare involves the same trade-off: shave two seconds off the cycle, and the price, complexity, and maintenance burden all climb together.
Balance them by specifying a cycle time comfortably below your takt time, then comparing machines on cost per good part over the machine’s life — not purchase price alone. A slower machine with higher uptime and lower scrap often out-produces a faster machine across a full year.
Fastest is not the same as best. I say this even though we build high-speed equipment. Some buyers push hard for the shortest possible cycle time, while their own operations team quietly cares more about reliability and quick changeovers. Both sides have a point, and the honest answer depends on your volume profile.
Advocates of dedicated high-speed automation argue that stable, large volumes justify a purpose-built machine with the lowest unit cost. They are right — but only when your product design and demand are genuinely stable at the million-plus level where a rotary indexing table shines. Flexibility advocates counter that product mixes change, engineering revisions happen, and demand is volatile, so reconfigurable robotic cells 5 and modular assembly systems are the safer investment. They are right too — for medium-volume, high-mix products. Your job is to place your own product honestly on that spectrum, not to pick a philosophy.
Here is a comparison pattern we show buyers during customization discussions:
| Metric | Machine A (faster) | Machine B (balanced) |
|---|---|---|
| Ideal cycle time | 4.0 seconds | 5.0 seconds |
| Theoretical annual output (3,750 h) | 3,375,000 units | 2,700,000 units |
| Realistic OEE | 65% | 90% |
| Actual annual good output | ~2,190,000 units | ~2,430,000 units |
| Relative price and maintenance burden | Higher | Lower |
Machine B is 25% slower on paper, yet it produces roughly 240,000 more good units per year because it runs. This is throughput optimization in its truest sense: sustained good output, not peak speed.
One more customization tip from our engineering side. Instead of paying for speed you cannot use today, ask whether the machine’s frame, drives, and control architecture can support future speed upgrades through motor or software enhancements. That latent capacity costs little now and protects you when demand grows.
Start with demand, not the brochure. Confirm bottleneck cycle time, uptime, and scrap in a real Factory Acceptance Test. Want capacity numbers grounded in your parts? Contact us.
