

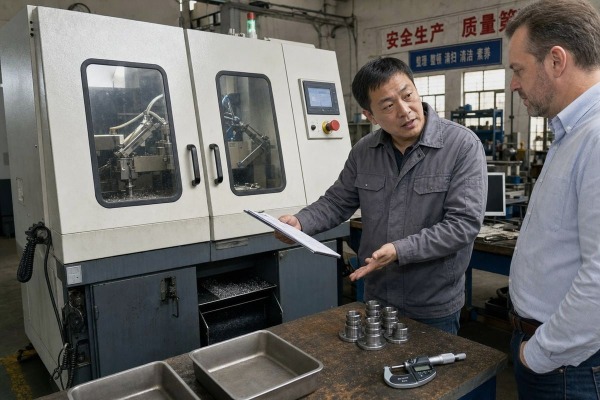
Sample test data when buying a chamfering machine 1 is the evidence I trust most. On our Wenzhou production line, I have seen buyers skip it, receive a machine that cuts one perfect demo part, and then fight scrap for months. That risk is avoidable if you treat the sample test like a controlled prove-out.
Record part details, machine settings, tooling condition, chamfer dimensions, burr height measurement, surface roughness, and cycle time per part for every run in a structured spreadsheet. Then analyze accuracy against tolerance, repeatability across parts, and drift over time before signing any purchase order.
That short answer covers the framework. Now let me walk through each stage, from what to record, to how to analyze it, to how to use it at the negotiating table.
A buyer from Mexico once asked me to "just send a video of the machine running." I sent the video, but I also sent a full sample test file with photos and measurement logs. He later told me that document, not the video, was what convinced his technical lead.
Record part information, machine model and settings, tooling type and wear state, fixture setup, feed and speed parameters, measured chamfer size and bevel angle precision, burr presence, surface roughness Ra value, cycle time per part, operator name, and timestamps for every single test run.

The biggest mistake I see is buyers recording only the output — the chamfer size — and nothing about the conditions that produced it. Without context data, you cannot reproduce the result, and you cannot tell whether a good part came from a good machine or from a lucky setup. When we run sample tests for customers at our factory, we log every field before the first cut. My personal rule is simple: communicate actively with your supplier, and ask them to record photos, videos, and measurement data, then compile everything into a sample test file they send you. That keeps information timely and verifiable.
Break your log into three layers: inputs, process, and outputs.
| Category | Fields to Record | Why It Matters |
|---|---|---|
| Part inputs | Part number, revision, material, lot, material hardness testing result, drawing chamfer spec | Different lots and hardness levels change cutting behavior |
| Machine and tooling | Model, serial number, CNC control interface version, cutter type, tool wear state, offsets | Lets you reproduce the setup later |
| Setup | Fixture ID, clamp method, datum, part orientation | Small setup changes can shift results |
| Process | Feed rate, spindle speed, depth, pass count, coolant setting | Needed to attribute changes to causes |
| Outputs | Chamfer width, bevel angle precision 2, burr height measurement, Ra value, cycle time per part | The evidence you will actually judge |
| Context | Operator, shift, date/time, ambient temperature | Supports traceability and audits |
Use a spreadsheet or CSV with one row per test run. Give each run a trial number. Add a pass/fail column and a free-text notes column for chatter, unusual sounds, or chip formation issues. This format exports cleanly and lets you compare fifty runs in minutes instead of digging through photos.
There is a trade-off I weigh on every project: a machine tuned for the tightest dimensional tolerance 3 often runs slower, while a machine tuned for speed may drift. The analysis stage is where you find where a specific machine sits on that curve.
Compare each measured chamfer to the target spec for accuracy, calculate the mean and range across at least 20 to 30 parts for machine repeatability, and check for drift as the tool wears. Consistent results within tolerance, at acceptable cycle time, confirm precision and production readiness.

Analysis does not require advanced statistics. It requires discipline. Our engineers follow a plain sequence when we validate equipment before shipment, and I recommend buyers use the same one.
One warning from experience: if the vendor measures with calipers on Monday and an optical comparator 6 on Tuesday, the data is not comparable. Agree on one metrology method 7 — gauge, microscope, vision system, or CMM — before testing starts. Inconsistent measurement can make a good machine look bad, or worse, a bad machine look good.
A Canadian procurement manager once sent identical parts to us and two other suppliers, then complained that the three sample reports were impossible to compare. Each supplier had tested differently. That experience taught me why a buyer-defined test brief matters more than any brochure.
Send every supplier the same parts, same material lot, same drawing, and same written test brief. Require identical run counts, one agreed measurement method, and results in the same spreadsheet template. Judge suppliers on accuracy, repeatability, cycle time, and documented evidence, not demo impressions.

Fair comparison starts before any metal is cut. If each vendor optimizes their own demo, you are comparing sales skill, not machines. Here is the method I recommend, and the one we are happy to follow when buyers ask us for sample testing on our metal processing machines.
| Criterion | What to Compare | Red Flag |
|---|---|---|
| Accuracy | Mean deviation from target chamfer spec | Mean sits near tolerance edge |
| Repeatability | Range and standard deviation across all parts | Wide spread or outliers |
| Edge quality | Burr height measurement and Ra value | Burrs that need secondary deburring |
| Speed | Cycle time per part and production throughput per hour | Quality only holds at slow settings |
| Stability | Drift from first to last part | Dimensions shift with tool wear |
| Documentation | Completeness of the sample test file | Verbal claims without logged data |
Ask each supplier to deliver a package: the raw data spreadsheet, measurement photos, videos of the actual runs, and notes on any adjustments made mid-test. In my own practice, I push our team to send this proactively because it keeps communication fast and honest. A supplier who resists structured documentation before the sale rarely improves after it.
Early in my export career, I learned a lesson that changed how I quote: a buyer who arrives with organized test data gets treated as a serious partner, and the conversation shifts from price haggling to performance guarantees. That shift benefits both sides.
Use recorded test data to convert vague promises into contract terms: write measured tolerance, repeatability, burr limits, and cycle time per part into the acceptance criteria. Tie payment milestones to reproducing the sample results during pre-shipment and on-site commissioning tests.

Sample test data is negotiating leverage because it removes ambiguity. When both parties agree on documented numbers, disputes about "the machine is not performing" become measurable questions instead of arguments. Here is how I suggest structuring it.
Take the best stable results from the sample test — not the single best part — and write them into the contract as the acceptance standard. Include chamfer width tolerance, bevel angle precision, maximum burr height, target Ra value, and guaranteed cycle time per part. Also define the test procedure itself: sample count, material lot, and measurement method. If the machine reproduced these numbers once under controlled conditions, the supplier can reasonably commit to them again.
| Negotiation Lever | How Sample Data Supports It | Typical Term |
|---|---|---|
| Payment schedule | Pre-shipment test must match sample results | Balance paid after documented FAT |
| Warranty scope | Tool life analysis data sets wear expectations | Consumable life commitments |
| Training and commissioning | Setup records show complexity of changeovers | On-site or remote commissioning support |
| Spare parts | Drift data reveals wear-prone components | Priced spare kit included |
| Customization | Gaps found in testing justify modifications | Fixture or CNC control interface changes at agreed cost |
If the data shows a weakness — say, burrs on a harder material lot — do not simply demand a discount. Ask the supplier to solve it: a different cutter grade, a revised fixture, or adjusted parameters, then a re-test with a fresh sample test file. At our shop we often modify tooling based on exactly this kind of feedback, because OEM adjustments before shipment cost far less than field fixes after. A supplier willing to iterate on documented data is usually the supplier who will support you after delivery too.
A demo part impresses; documented data protects. Record every run, analyze repeatability and drift, compare suppliers on identical briefs, and write the numbers into your contract before you buy.
1. Provides a technical definition of chamfering and its applications in manufacturing. ↩︎
2. Defines the geometric concept of a bevel and its measurement in technical contexts. ↩︎
3. Explains the importance of tolerances in engineering and manufacturing quality control. ↩︎
4. Academic overview of factors affecting tool wear and life in machining processes. ↩︎
5. Authoritative Wikipedia entry explaining surface roughness parameters including the Ra value. ↩︎
6. Describes the function and use of optical comparators in industrial inspection. ↩︎
7. Official government resource on measurement standards and metrology practices. ↩︎
